
X Executive Revenue Kit · R1
Three pages that explain a target gap.
One editable Power BI project with three native pages: Executive Overview, Target Gap Analysis and Customers & Regions. Behind them sits a star-schema model with a date table and documented measures. Navigation and slicers work. The theme is light. The data is original and synthetic, and a data dictionary and a guide to replace it with yours come with the project.
The three pages
Open on the answer, then ask why.
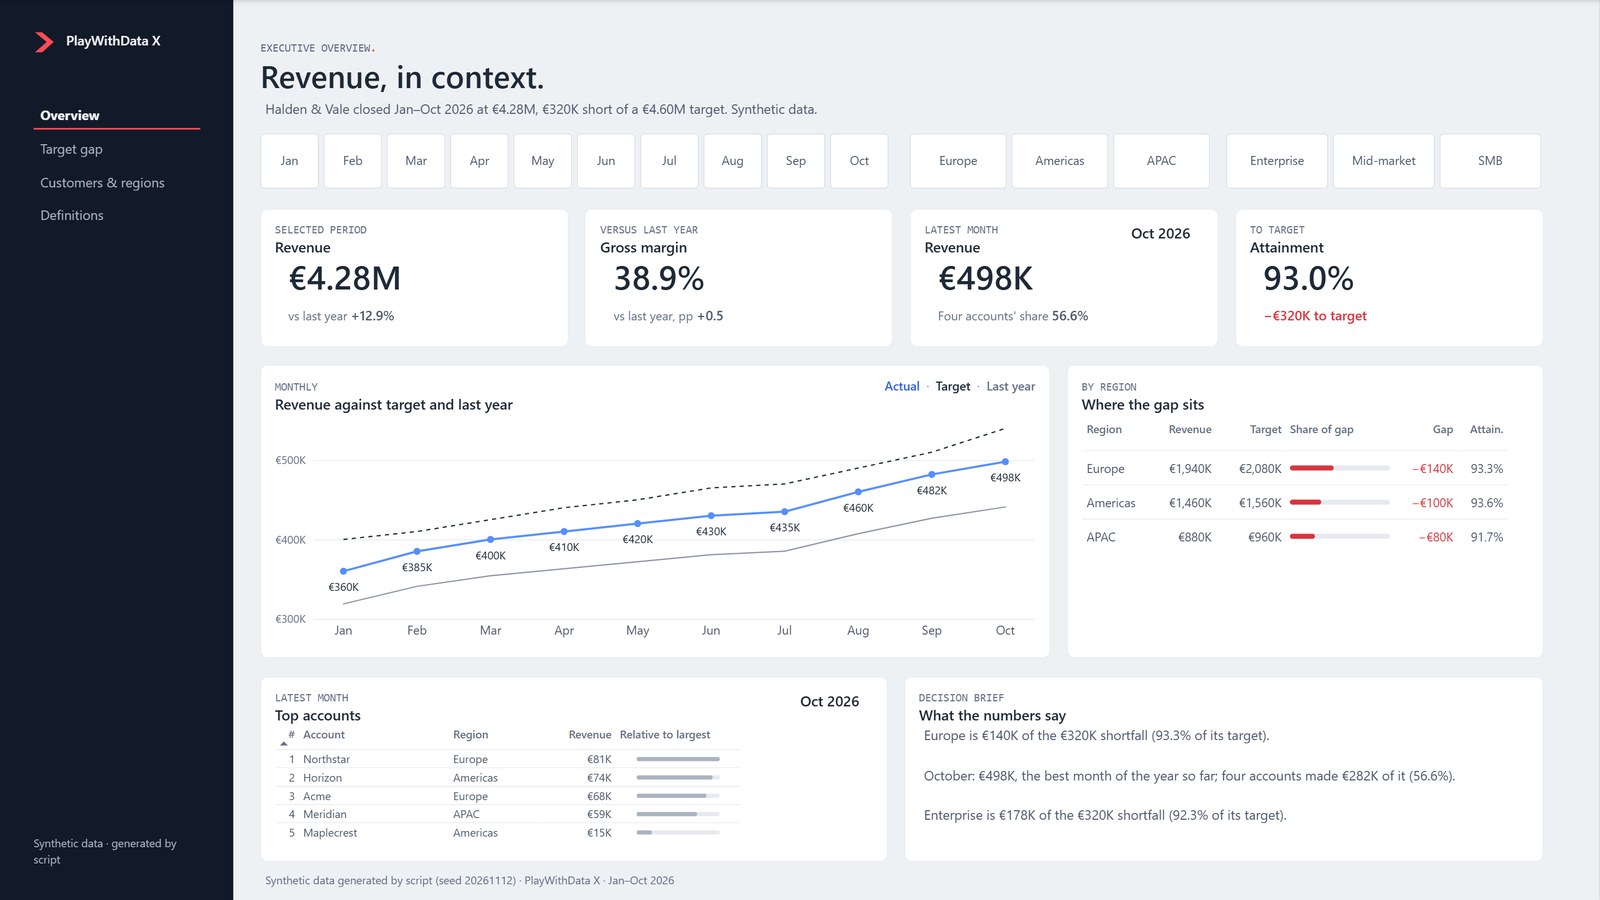
Executive Overview
Revenue against target for the period, with the trend by month, a region table, the top accounts and a short decision brief. The page a review meeting opens on.
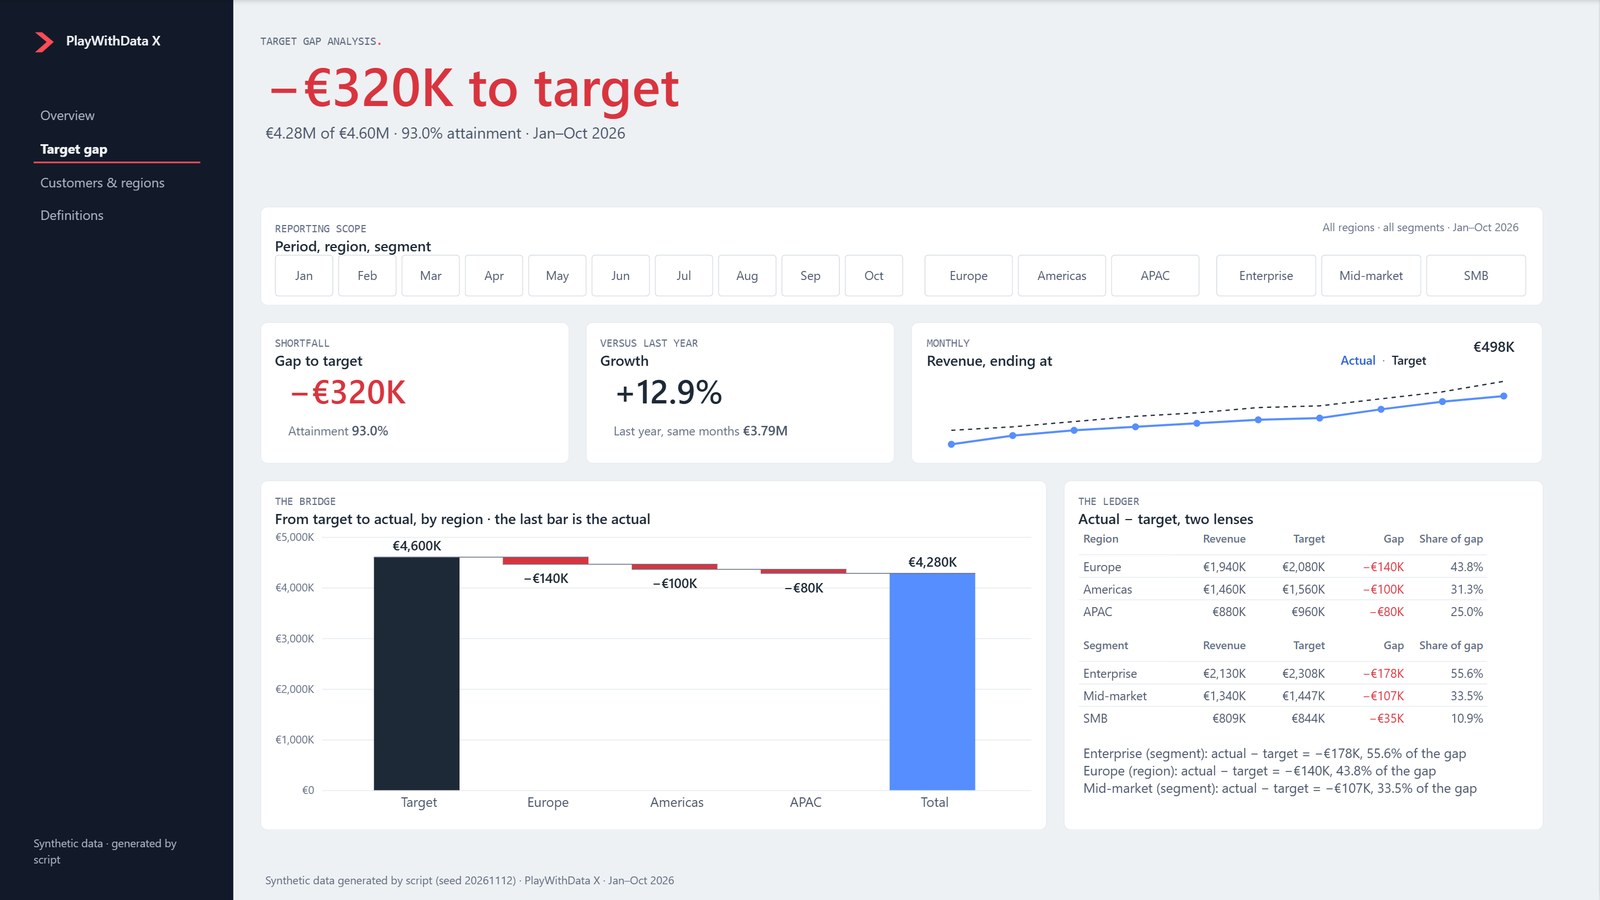
Target Gap Analysis
Where the gap to target sits, by region and by segment, with a waterfall from target to actual. It states the gap. It does not claim a cause.
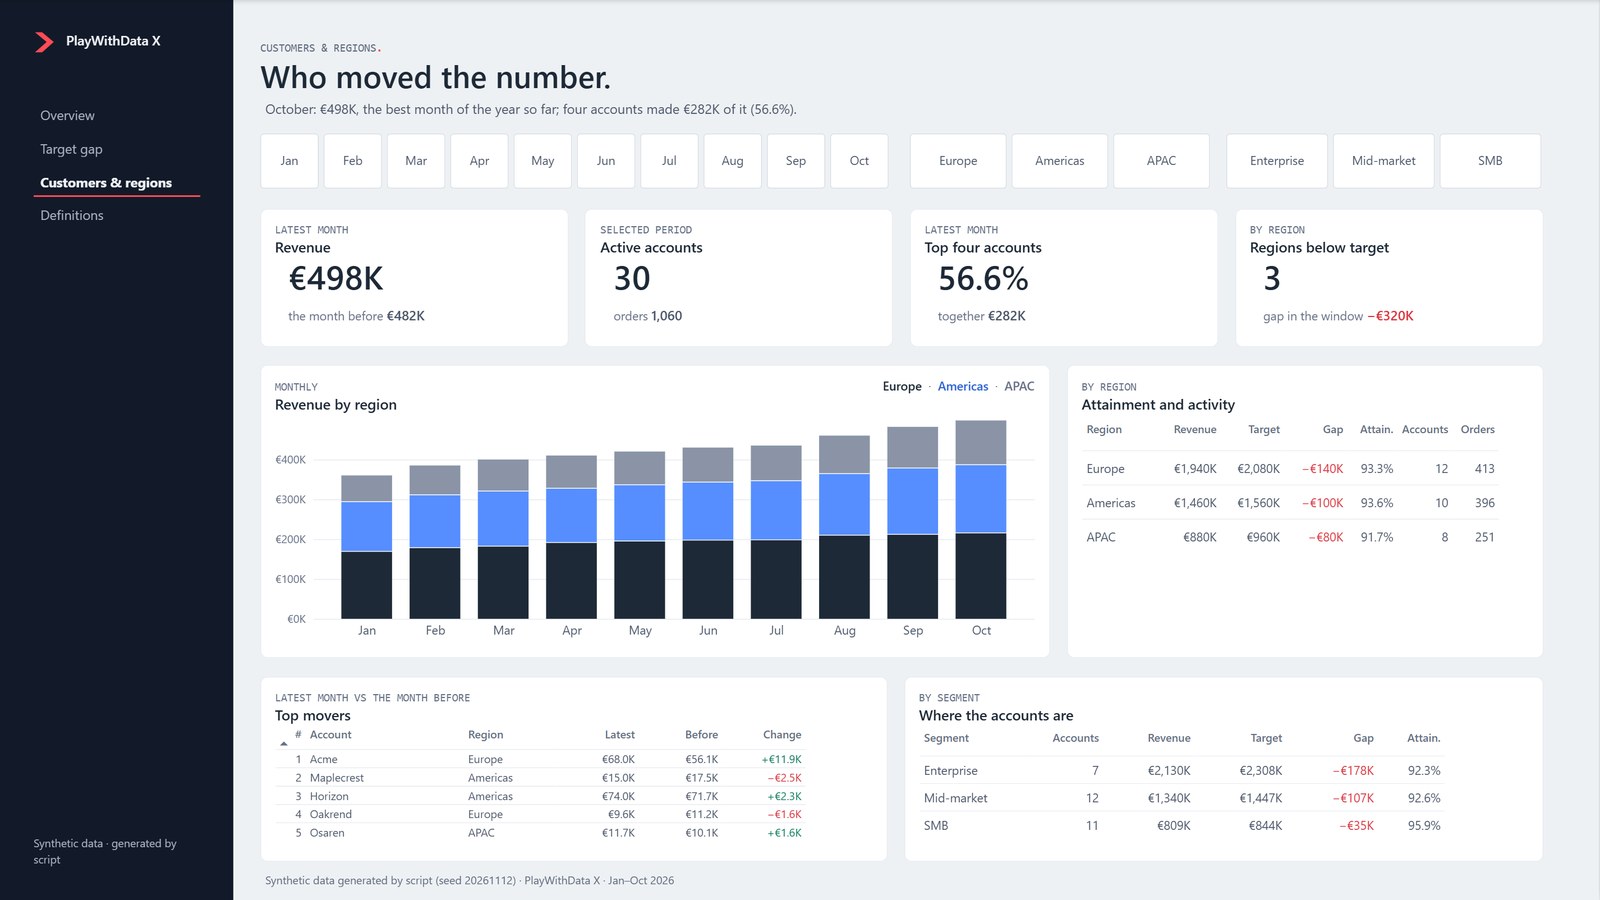
Customers & Regions
Who moved the number: monthly revenue by region, the top five movers against the month before, ranked by the size of the change, and the accounts by segment.
What is inside
One project, nothing hidden.
A zip you open in Power BI Desktop. The report and the model are text files, so every change you make shows in a diff.
In the zip
- One editable PBIP: the report and the semantic model, as text files
- Three native pages: Executive Overview, Target Gap Analysis, Customers & Regions
- A star-schema model with a date table
- Documented measures
- Working page navigation and slicers
- A light theme
- Original synthetic data for a fictional company
- A data dictionary, and a guide to replace the data with yours
Requirements
- Power BI Desktop 2.159 or later, with the PBIP and PBIR preview features switched on
- Opens offline. There is no data source to connect
Limits
What it will not do.
Read these before you buy. They are the reasons to say no.
- 01
Import mode only. There is no DirectQuery or Direct Lake version.
- 02
No row-level security. Every person who opens the file sees every row.
- 03
Segoe UI and Consolas are assumed; they are not embedded.
- 04
The data is synthetic. It shows how the report behaves and says nothing about your business.
- 05
Desktop pages at 1920×1080 only; no phone layout in R1.
- 06
The design is one of two candidates built and tested on the same model. Nothing says it is the best fit for your team.
How it was built
Checked before it was sold.
- 01
Generated from one fixture
A script writes the synthetic data. Every figure on every page traces to that one fixture, and the totals reconcile to the cent.
- 02
DAX tests on the engine
The measures are tested by running DAX queries against the model on the Power BI engine, not by reading the formulas.
- 03
An interaction gate
Every slicer, every page button and the table cross-filters were clicked on Power BI Desktop and the captures checked.
- 04
Independent review
A reviewer who did not build the kit checks the result against its specification before it is released.
Licence
One purchaser, any project.
- One purchaser holds the licence.
- Use it on your own projects and on your clients’ projects.
- No resale and no redistribution of the kit.
- The PlayWithData X mark, name and coral/navy theme ship in the kit for your own use; before you publish or hand a report to a client, replace them with your own (the kit’s docs list the five places).
- The synthetic data is CC BY 4.0: you may reuse it, with credit.
Seller and terms
Who sells it, and on what terms.
- Seller
- PlayWithData · Mihai Lăpușneanu · Iași, Romania
- Price
- €49, one time. VAT is added where it applies.
- Invoice
- Sent by email after purchase. To pay by invoice instead of by card, email mihai@playwithdata.io.
- Withdrawal
- The kit is a digital download. You ask for immediate delivery at checkout, and once the download starts you lose the 14-day right of withdrawal that would otherwise apply. If you do not agree, do not tick the box.
- Support
- By email, to mihai@playwithdata.io.
- Refunds
- A kit that does not open in a current Power BI Desktop is refunded.
Questions
Four things people ask.
- Can I use my own data?
- Yes. The guide lists the columns each table needs. Keep the model’s table and column names and the measures keep working; rename them and you edit the measures to match.
- Do I need a paid Power BI licence?
- To open and edit the kit, no: Power BI Desktop is free. Publishing to the Power BI service needs whatever licence your own organisation requires.
- Can I use it in a client project?
- Yes. One purchaser, on your own projects and your clients’ projects. You may not resell or redistribute the kit itself.
- What if it does not open?
- A kit that does not open in a current Power BI Desktop is refunded. Email the Desktop version and what you see.